Front-end workers are a company’s show-runners. Being at the forefront, they brave the pressures of offering excellent customer service regularly.
97% of global customers say customer service directly affects brand loyalty and their purchasing behaviors, according to a 2017 Microsoft survey. The work isn't just about picking up the phone 24/7; it includes setting up customer relationships, defending brand values along the lines of satisfaction and efficiency.
Thus, here it becomes necessary to create and maintain standards for high employee performance. This is achieved by tracking specific workplace metrics that can analyze data and predict the company's direction.
Contents
1. Satisfaction Rates for Customers
2. Service Level
3. Customer Effort Score
4. First-Call Resolution
5. Agent Utilization Rate
6. Abandon Rate
7. Average Handling Time
8. Call Availability
1. Satisfaction Rates for Customers:
One of the more critical call center metrics is measuring the customer satisfaction rate. Businesses will often use metrics along the lines of the Net Promoter Score (NPS). This metric helps a firm measure in quantifiable amounts what the customer thinks of their goods or services.
This is also an excellent method when used alongside customer reviews to gauge the effectiveness of the company's processes. Net Promoter score is one of the popular metrics used by many companies to measure customer satisfaction, loyalties and predict the growth of the business.
The companies find NPS is attractive as it counts on a simple questions like
“ How likely you are recommending our brands [company X] to your friends & colleagues?"
The NPS Calculation:
Customers respond using a 0-10 rating scale, with responses grouped into three categories:
Promoters (9-10) means loyal to the brands. They keep buying as well refers other
Passives (7-8) means satisfied customers who are vulnerable and exposed to your competitor’s offerings.
Detractors (0-6) mean real unhappy customers. They may damage the reputation of your brand obstruct the growth through harmful word-of-mouth.
% Promoter - % Detractors = NPS

CSAT Score is another most popular call center metric collected after a call. This determines the satisfaction level of the customer after the call. Usually after the call, the customer may be requested to transfer to CSAT Survey where an IVR Systems collects the Satisfaction score between 1 to 5. This is a simple indicator to the agent how much satisfied the client was with that specific interaction.
2. Service Level
Service level can be described as a metric that gauges the percentage of answered calls within a stipulated time frame. It means SLA is a call center’s legal responsibility to maintain a standard of service between the clients and customers. Thus, SLA is an agreement that a contact center is committed to answering a percentage of calls within a specified number of minutes or seconds.
For example, some workplaces state overtly that they target answering “X percent of calls answered in Y seconds”, usually applying 80/20 rule – “80% of calls answered within 20 seconds”. This is then considered as the service level goal for the business.
Service level is one of the critical call center metrics that accurately indicate the firm's resources to meet the customer's goals. It demonstrates whether the service response is timely, accurate, and efficient. If the service level is inadequate, changing business tools or hiring more employees could be the solution.
3. Customer Effort Score
Customer Effort Score (CES) which was introduced by Gartner in 2010, is a key metric behind providing a world-class customer experience. However, Gartner survey with clients indicate, less than 10% actually use CES.
The goal of the CES question is to understand the extent to which the company makes handling customer interactions easy.
Like NPS, in this case also, it is a single question to evaluate the effort the customers had to put to get their issue resolved.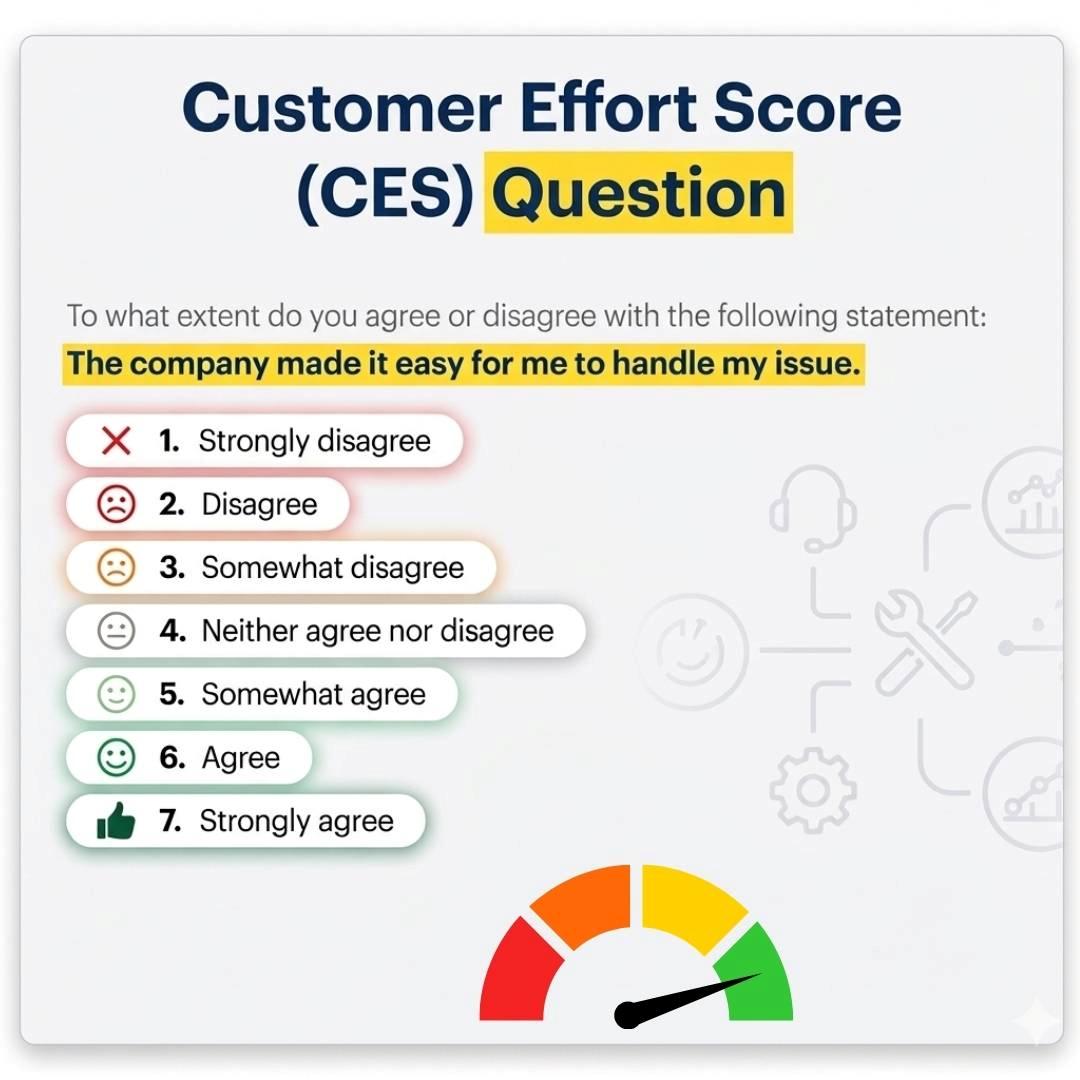 It is interesting to note that:
- Lower CES scores are directly correlated with lower customer loyalty, and increasing costs to serve the customer
- Customer effort is a mix of how customers feel and what they have to do during an interaction.
4. First-Call Resolution
The First-Call Resolution (FCR) metric is used to measure how many incoming service requests were resolved in the first interaction with the customer. This is a fundamental call center metric that should be tracked. The FCR rate is an excellent indicator of how professional a company is at resolving customer issues.
Recent research advocates that first call resolution is the top priority KPI for customer satisfaction than any other metrics. According to the report published by customer contact research and consulting firm Service Quality Measurement (SQM) Group, a company gets a 1% increment in customer satisfaction for each 1% improvement in FCR. SQM also found that the contact center who achieved world class customer satisfaction scores had a FCR average of 86% compared to the non-elite center had a FCR average of 67% only.
The contact centers that have achieved higher FCR, they don’t only enjoy the customer satisfaction but also enjoys:
1. Lower Operating Cost:
A low first call resolution contact center gets a large number of repeat calls – increase the cost load of call-backs especially for the big company size contact center
2. Loyal to the brand:
According to SQM research, the customer whose issue gets resolved on the first call, only 3% of them are at risk to desert the brand compared to a whopping 38% of customers at risk of defecting to its competitors if the issue is not fixed on the first call.
Needless to say, to improve the FCR Rate, bi-weekly training and providing knowledge base to agents are the best practices to follow.
5. Agent Utilisation Rate
To ensure that the agents time is utilized properly, this call center metric is usually used. This metric lets you know the agent productivity.
So, it is a ratio of amount of actual work performed to the available hours.
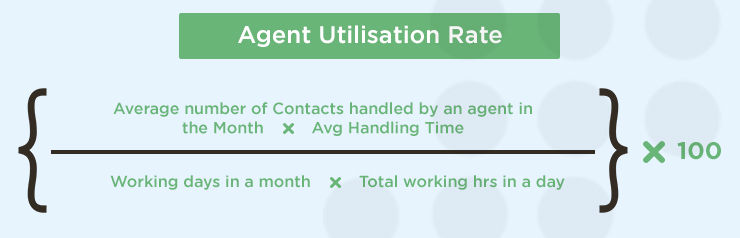
To be more precise, the break times, training hours, holidays and vacations should be removed from the denominator.
A good balance of the Agent Utilization Rate ensures maximizing productivity and avoiding the agent burn out. Usually 75% Agent utilization rate is supposed to be a good balance.
6. Call Abandon Rate
Call Abandon rate could be defined as the ratio of calls that are ended or terminated before the call is answered by the agent to the total calls offered. The industry standard of a call center call abandonment rate is between 5% to 8%. But it could reach up to 20% as well under some extraordinary circumstances. According to Marchex Inc study, one in five calls from mobile phones is abandoned.
Having high customer satisfaction rates while simultaneously having very high termination rates is indicative of something larger. This could demonstrate that the call system in use could very well be inadvertently dropping calls. This is a crucial call center solution metric since these issues need immediate resolution, without which customer experience can be negatively influenced.
How to calculate call abandon rates?
To calculate the abandon rates, follow the below formula:
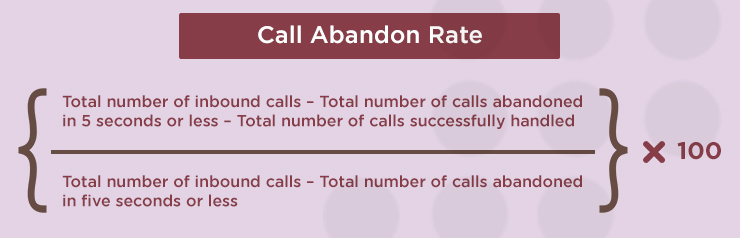 So now if a call center received 100 calls in a day, had 20 of them were abandoned in 5 seconds or less, but 75 of them successfully served well, then the calculation looks like that:
(100 – 20 - 75)/(100 – 20) X 100 = (5/80) X100
In the above example, the call abandon rate for the call center is 6.25%
Higher Call Abandon Rates indicate that the clients are waiting in queue more than they except to wait for. So, it is effective to have more agents in the campaign to avoid higher waiting time.
7. Average Handling Time
Average Handling Time (AHT) delineates the quantity of time that an agent spends on a call. While the qualitative markers for this metric often differ by industry, most call centers aim to scale back the normative handling rates as much as they can. Lower AHT suggests that employees are more efficient, mean lesser service reps to handle phone calls.

This is a key parameter between agent productivity and customer satisfaction. When agents routinely exceed this threshold, it could be that they need training/skills to close the call within threshold, to maintain productivity. By contrast, if agents are far below this threshold, they may be rushing through calls and not addressing customer issues completely and could lower the customer satisfaction.
It's essential to be at home with these metrics and observe them regularly. Misusing or wrongly interpreting this data can have serious consequences, including, but not limited to, hampering the call center's growth and achievement of goals. Understanding these simple call center metrics will help the team achieve much greater efficiency than competitors.
Call availability demonstrates how often employees are available to answer incoming service requests and how long they take to respond to them. This call center metric provides the higher-ups with a good indication of whether employees are working as scheduled or not. Managers can look into call records and pursue action if necessary, after checking whether it was a busy day or if the employee was absent.
Call availability as a metric also empowers teams to determine the call center's peak hours of traffic. Managers can then formulate schedules according to hours that consistently present low availability rates for employees to handle the increased demand.
Start Tracking These Call Center Metrics Today
It is essential to remember that every call centre will not have 100% success rate. No matter how outstanding the service is, there will be some customers whom you can't satisfy. However, this shouldn't prevent any business from offering a premium customer service. Measuring your success rate is important to meet your daily KPIs and reach your targets strategically.